Nvidia (NVDA) recently released its earnings report on May 22nd 2024, resulting in the stock reaching an all-time high of $1,063. Notably, there was significant unusual options activity observed, particularly in the $1,000 call contracts expiring on June 21, 2024, leading up to the earnings announcement.
To determine whether institutional investors, often referred to as “smart money,” were indeed purchasing these options, we need to delve deeper into the data and analysis.
Volume and Open Interest

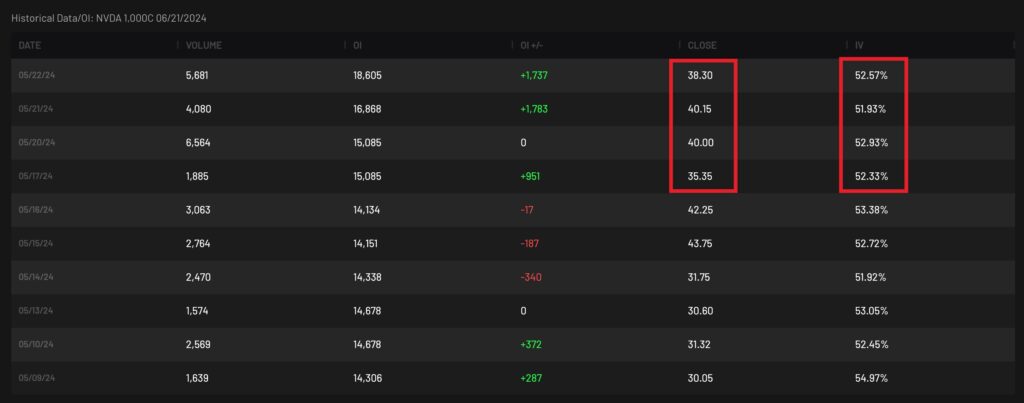
If we analyze the volume and open interest data from the past week, we can identify several indicators that suggest “buying” activity:
- Consistent Increase in Open Interest: Over the last five days leading up to the significant event, there has been a continuous rise in open interest. This trend indicates that new positions are being established, reflecting growing market interest and participation.
- Volume Relative to Open Interest: Throughout this period, the trading volume has consistently remained below the open interest. This scenario is a robust indicator that the majority of the trading activity involves the opening of new positions rather than the closing of existing ones. Such a pattern typically signifies a bullish sentiment, as traders are entering the market with new contracts rather than liquidating their current holdings.
Trade Side Distribution

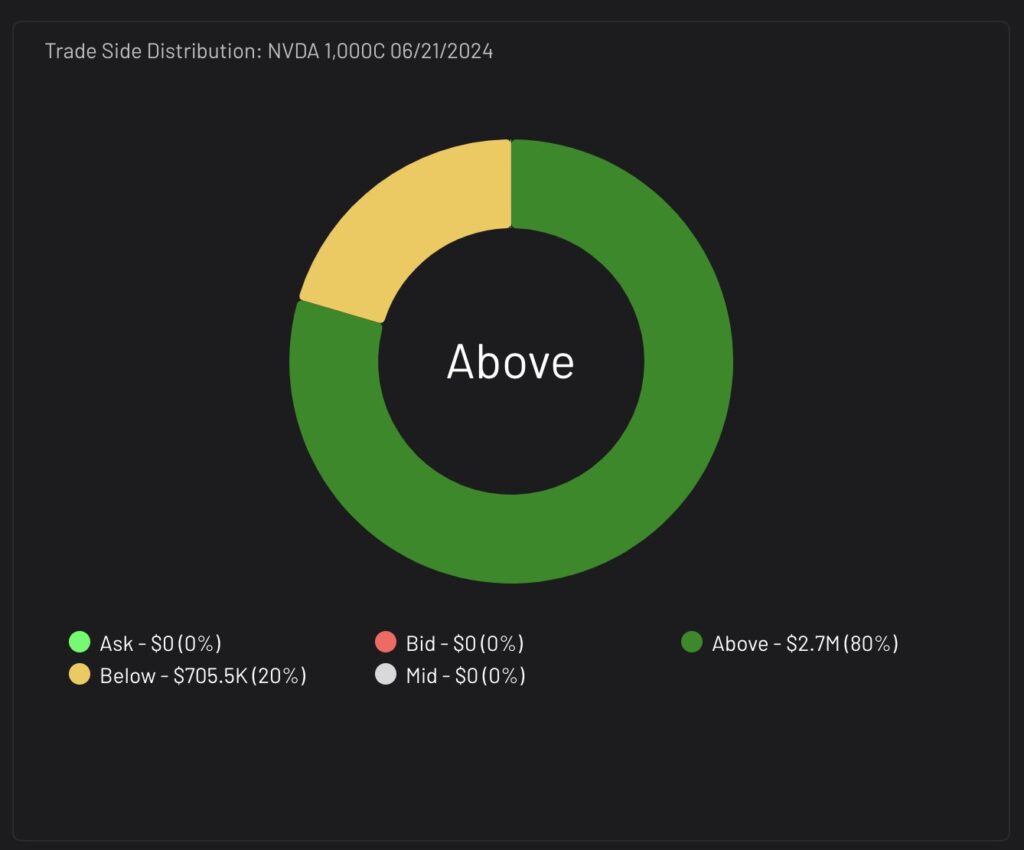
When examining the trade side distribution of the contract, it becomes evident that over 80% of the trades were executed above the ask price, indicating strong buying activity. Conversely, only 20% of the trades were executed below the bid price, which suggests limited selling activity.
However, one might argue that these trades could represent “buying to close” positions. While this is a valid consideration, the implied volatility (IV) of the contracts provides further insight. More on this below.
Contract Price and Implied Volatility

Other data points, such as the price and implied volatility of the contract, are also crucial when attempting to identify potential smart money buying activity. Consider the following indicators:
- Implied Volatility: Observe if the implied volatility remains within a neutral range despite significant volume entering the contract on a given day. This stability can suggest that the activity is driven by new positions rather than the closing of existing ones.
- Contract Price: Monitor the price of the contract to see if it stays within a relatively small or neutral range, especially when compared to its historical performance. This consistency can indicate that the market is absorbing the volume without significant price fluctuations, which is often a sign of accumulation.
Note: Sellers typically aim to close out their positions when implied volatility is spiking, as this can maximize their returns from the elevated premiums.
Understand the Time Value of the Contract
The contract in question still had approximately 30 days until expiration. When we observe contracts with longer durations until expiration, it often indicates that institutional investors, or “smart money,” are purchasing these options. This strategy is typically employed to minimize exposure to time decay while placing bets with larger premiums.
BONUS: Identify Out-of-the-Money contracts: A sudden spike in activity for these options might suggest that some traders anticipate a major positive catalyst for the stock.
Conclusion
To identify buying opportunities in options flow, it’s crucial to analyze the trade side distribution data, the relationship between volume and open interest (both intraday and historically), and how the price and implied volatility have shifted. While no method is 100% accurate, these factors can help create a higher conviction that the trades were indeed buys.
Options flow analysis is just one piece of the puzzle when it comes to making informed trading decisions. By combining options flow insights with fundamental and technical analysis, traders can gain a more comprehensive understanding of the market and potentially identify profitable trading opportunities.


