The Bear Flag, serves as a powerful indicator for traders looking to capitalize on downtrends. This expert guide delves into the intricacies of the Bear Flag pattern, offering a comprehensive overview of its meaning, identification, and trading strategies. By mastering this pattern, traders can enhance their ability to predict market movements and execute trades with greater precision.
What is a Bear Flag Pattern?
A bear flag is a technical analysis pattern used on stock charts to predict a potential continuation of a downtrend. It’s essentially the opposite of a bull flag, which signals a possible trend reversal upwards.
Bear flags are most reliable when preceded by a significant downtrend. The strength of the pattern increases with a steeper flagpole and a tighter consolidation period in the flag.
Anatomy of a Bear Flag
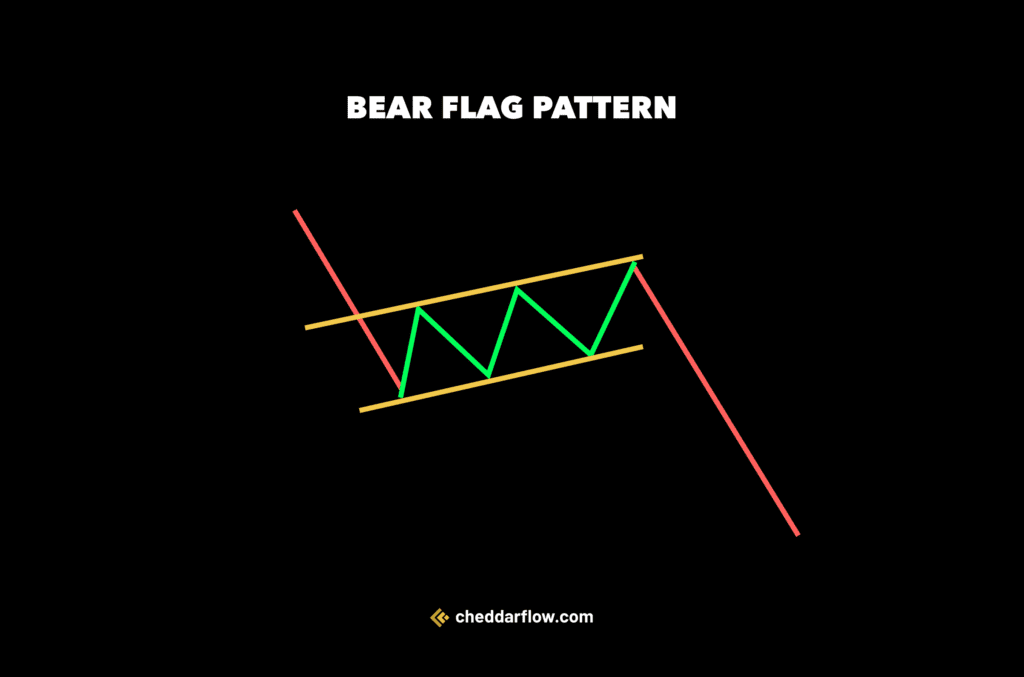
The bear flag has two parts:
- Flagpole: This is a sharp downward movement in price, representing a period of strong selling pressure. High volume usually accompanies the flagpole.
- Flag: This is a brief consolidation period following the sharp decline. The price action forms a rectangle-like pattern with two parallel trendlines, one for resistance (upper) and one for support (lower). Ideally, volume during the flag formation is lower than during the flagpole.
The bear flag suggests that the initial downtrend has paused briefly for consolidation, but the sellers are likely to regain control and push prices even lower.
What it tells us
The bear flag pattern tells us that there is likely to be a continuation of a downtrend in the price of an asset.
It suggests that after a sharp decline in price, there is a period of consolidation where the price forms a flag-like pattern. This consolidation indicates a temporary pause or hesitation in the market.
How to trade the Bear Flag
To trade a bear flag, look for a confirmation breakout where the price closes below the lower trendline of the flag. This breakout suggests the sellers are back in control.
Keep this in mind when trading it:
- Entry: Traders typically wait for a confirmation breakout, which occurs when the price closes below the lower trendline of the flag.
- Stop Loss: A stop-loss order can be placed above the broken trendline to limit potential losses if the pattern fails.
- Target Price: The target price for a short position could be the height of the flagpole measured from the breakout point and projected downwards.
Estimate a target price by measuring the height of the flagpole and projecting it downwards from the breakout point.
This indicates where the price might reach if the downtrend continues
Real-Life Example: Bear Flag
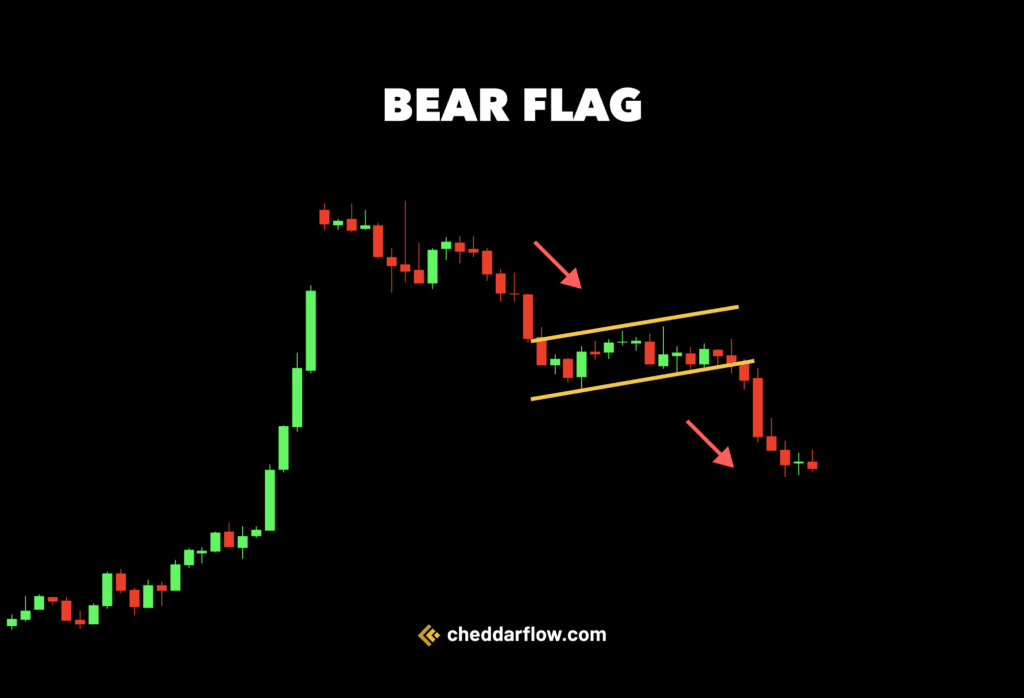
You’re looking at a stock chart, and you notice a bear flag pattern forming. Here’s how it might look:
- Initial Decline: The stock price experiences a sharp downward move, indicating bearish sentiment. This forms the flagpole of the pattern.
- Consolidation: After the initial decline, the stock enters a period of consolidation. During this phase, the price forms a rectangular-shaped pattern, which resembles a flag waving down a pole. This consolidation phase typically involves lower trading volumes.
- Continuation Decline: Following the consolidation phase, the stock price breaks below the lower trendline of the flag pattern, signaling a continuation of the downtrend. This move confirms the bearish bias and often leads to further downside momentum.
This pattern is considered a bearish continuation pattern, suggesting that the previous downtrend is likely to continue.
It’s essential to wait for confirmation through a decisive breakout below the flag pattern before considering any bearish trades.
Pros & Cons of this pattern
| Pros | Cons |
|---|---|
| Provides clear visual indication | False signals can occur, leading to losses |
| Helps identify potential downtrends | Requires confirmation before acting |
| Can be used for short-selling | Not always reliable in all market conditions |
| Offers defined entry and exit points | Requires patience and discipline to trade effectively |
Frequently Asked Questions
Can a bear flag be bullish?
No, a bear flag pattern is inherently bearish, indicating a continuation of a downtrend in the price of an asset. It suggests that after a sharp decline, a period of consolidation occurs, followed by a further decline in price.
How reliable is a bear flag pattern?
The honest answer is: The reliability of a bear flag pattern varies.
While it can be a useful tool for identifying potential downtrends, it’s important to confirm the pattern with other technical indicators and consider market conditions.
False signals can occur, so traders should exercise caution and use proper risk management strategies.
What happens after a bear flag pattern?
After a bear flag pattern, the price typically continues its downtrend, as indicated by the pattern. Traders often anticipate further declines and may enter short positions or manage existing positions accordingly.
However, it’s essential to monitor the price action for confirmation and consider other factors before making trading decisions.